for a layer and select
 The Data Table appears at the bottom of the map section when you click the for a layer and select ![]() (View Data Table).
(View Data Table).
A sample data table appears below.
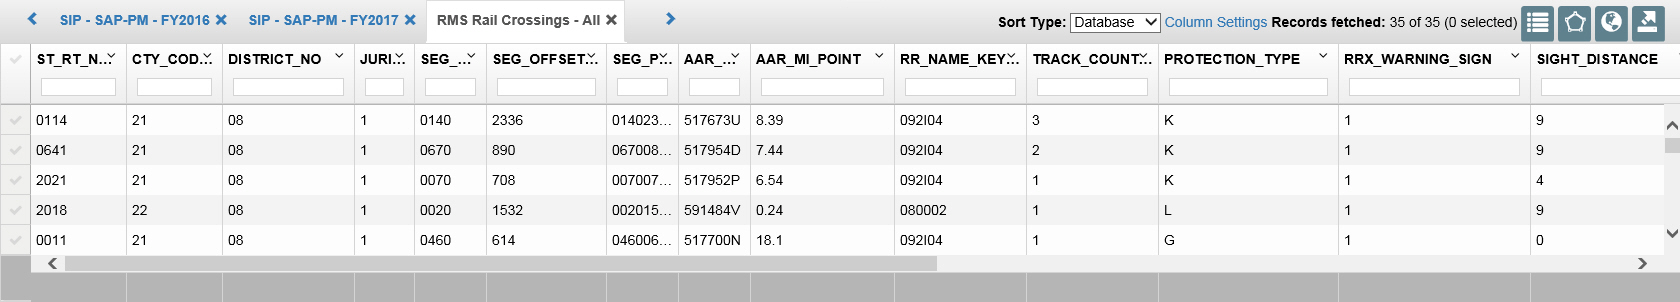
Each row represents a record in the data. In the sample above, each row shows data for an RMS Rail Crossing.
Click a checkmark on the side of the table to select a row.
Tip: You can resize the data table to display more or fewer rows by clicking the top of the table (above the control buttons) and dragging up or down.
Each column contains a characteristic stored for individual crossings.
Tip: You can resize columns for ease of viewing by clicking the column border in the header and dragging left or right. PennDOT One Map will remember your customized settings.
If you have opened data tables for multiple layers, arrows will display to scroll through the open data tables. Navigate to the desired data table by clicking arrows to scroll data tables currently open.
Sort Type - Select the order the columns are displayed in from this drop down list.
· Database - The columns are displayed in the order in which they appear in the database.
· Alphabetical - The columns are displayed in alphabetical order.
Tip: You can also click and drag column headers to move columns to any order you want. PennDOT One Map will remember your customized settings.
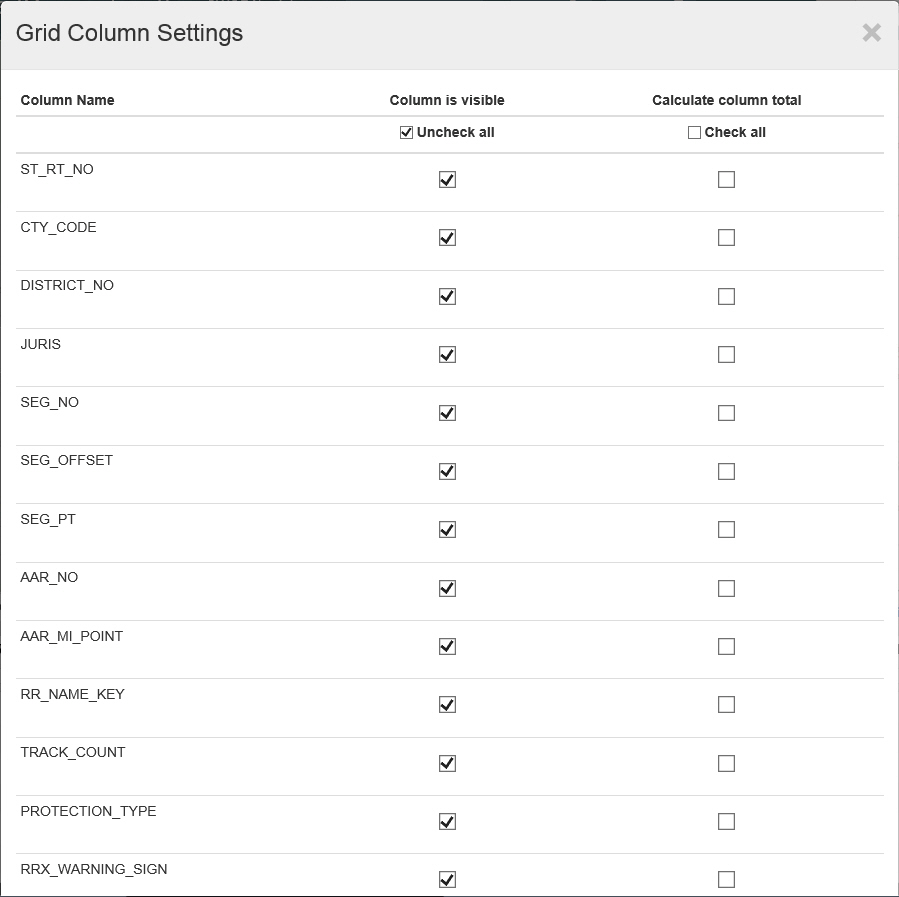
Column Settings - Click this link to display the Grid Column Settings window, which contains a list of all available columns. Select the columns you want to display under Column is visible and click OK. Columns not selected will be hidden. To get a sum of all values for a column, select the column under Calculate column total and click OK. The sum will appear at the bottom of the data table. PennDOT One Map will remember your customized settings.
Records to Fetch - Select how many records to retrieve for the Data Table. The default value is 1000.
Records Fetched - Indicates how many records were retrieved out of the total number available.
 (Show Only Selected) - Click this button to show only the selected records on the table.
 (Select From Map) - Click this button to draw a polygon on the map. The records associated with the area of the polygon will be selected in the data table and highlighted on the map. The highlight is rendered under Drawing Layers.
 (Map Selected) - Click this button to map the records selected on the table. On the map, the selected features appear highlighted yellow.
 (Export to Excel) - Click this button to create a Microsoft Excel spreadsheet from the data contained in the data table.
Note: If you have selected specific rows in the data table, only those selected results will be exported to the Excel spreadsheet.
 (Hide) - Click this button at the top of the data table to hide it. Click it again to show the table.
Click the down arrow  in any column's heading to display a menu where you can select one of the following actions:
· Sort Ascending - Sorts the Data Grid list by the selected column in ascending order (A-Z , 1-9, etc.).
· Sort Descending - Sorts the Data Grid list by the selected column in ascending order (Z-A , 9-1, etc.).
· Remove Sort - Clears the sort for the selected data grid column.
· Hide Column - Hides the selected column from view. The column will appear again when the data grid is re-loaded.
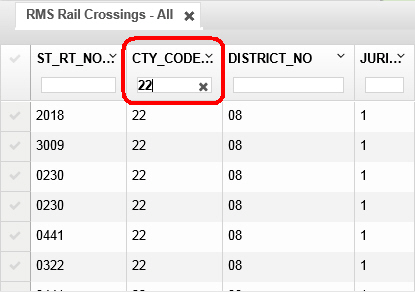
Tip: You can also filter by a column value. Type into the text box below the column's heading to display only rows with matching results. Click here for an example.